"They're Improving" Doesn't Cut It Anymore
You tell a parent at a meeting:
"Your child has really been improving lately. Their comprehension is getting much better."
The parent smiles. But inside, they're thinking:
There's a gap between the feeling that a student is improving and the evidence parents are looking for.
The tutors who can bridge that gap are the ones who'll thrive going forward.
What Cram Schools Have That Independent Tutors Don't
Major cram schools and private tutoring centers almost always have a system for visualizing teaching results.
- Graphs showing changes in standardized scores
- Accuracy rates broken down by topic
- Comparison reports against previous tests
Parents see this kind of data and feel reassured: "My child is in good hands here."
Meanwhile, what do independent tutors have?
Verbal updates like "they're improving." Handwritten notes. Past lesson details recalled from memory. No data to show parents.
Grade trend graphs. Topic-by-topic analysis. Auto-generated monthly reports. Parent portal.
This gap isn't a difference in teaching quality — it's a difference in presentation.
3 Ways Independent Tutors Can Visualize Teaching Results
Method 1: Build Up Lesson Records
The simplest and most effective approach. Record what was covered and how well the student understood it after every lesson, then make it accessible to parents.
That alone lets parents see for themselves: "Three months ago they were struggling with fractions, but now they've moved on to equations" — they can feel the progress firsthand.
Method 2: Show Attendance Data
"Out of 4 scheduled sessions this month, they attended all 4" — even this simple fact gives parents peace of mind.
Conversely, if there were many reschedules in a given month, just having a record that says "2 sessions rescheduled due to illness; carried over to next month" makes parents feel that things are being properly managed.
Method 3: Send Monthly Reports
Once a month, send a summary of that month's lessons. Creating these manually is tedious, but if you've been accumulating records from each session, simply auto-compiling them produces a solid report.
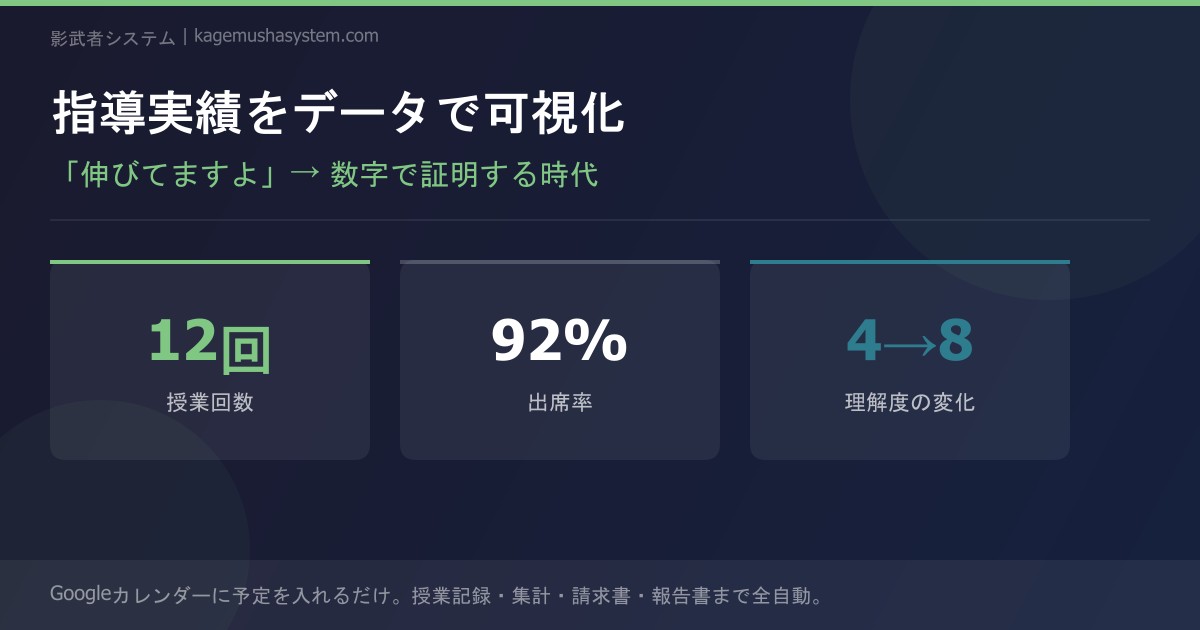
Numbers Speak Facts
Numbers are far more eloquent than any beautifully crafted copy.
A graph showing "calculation errors dropped 20% from last week" resonates with parents ten times more than a vague "they've been working hard lately."
Visualization Generates Word-of-Mouth
Tutors who visualize their teaching results find that word-of-mouth spreads more easily among parents.
Why?
Because a parent who sees the dashboard tells their friends:
"My kid's tutor shows us lesson records on a personal dashboard after every session. I can see attendance, costs, everything. They're really on top of things."
This is many times more effective than any self-promotion. "A tutor who has it together" — that kind of word-of-mouth is the ultimate student acquisition engine.
You Don't Need to Build the Visualization System Yourself
"Don't you need programming skills to visualize data…?"
Not at all.
With Kagemusha System, all you do is tap once after each lesson to log it, and the data automatically accumulates on the parent dashboard. Attendance, lesson records, monthly fees — everything is automatically made visible.
Step 1
Add the lesson to Google Calendar (just like you always do)
Step 2
Tap once after the lesson to log it (content, homework, comprehension level)
Step 3
Automatically reflected on the parent dashboard. Viewable anytime on a smartphone
Zero programming knowledge needed. Setup takes 5 minutes. That's all it takes to get teaching result visualization on par with major cram schools.
Summary
- The days when "they're improving" alone satisfies parents are over
- The gap between cram schools and independent tutors isn't teaching quality — it's presentation
- With accumulated lesson records and a parent dashboard, any independent tutor can achieve visualization
- Letting the numbers speak generates word-of-mouth and grows your student base
→ Learn more here
Still managing tutor attendance manually?
Discover Kagemusha System